Filter and Customize Your Data with the Latest Grapher Release
Another Grapher release is here! There are many exciting new features this release and as always our focus remains on increasing usability, improving workflows to increase time savings, and including the most commonly requested new features.
All active Grapher subscriptions can begin using these new features today.
- Filter Data In and Out of Your Plots
- Automatically Disperse Overlapping Labels
- Reorder Legend Entries for Text-based Class Plots
- Label Your Plots and Axes With Percentage Label Options
- Align or Distribute Objects to Page Margins
- Status Bar improvements
- Digitize in the Date/Time Format of Your Axes
- Automatically Reduce Clutter with the Worksheet Manager
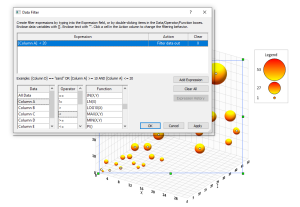
The new Data Filter replaces the current Criteria Filter in Grapher, and offers a lot more flexibility and functionality. Users can:
- Apply multiple inclusion or exclusion filters
- Work with multiple filters on different columns of data, or all data
- Use comparison and boolean operators
- Use built-in mathematical functions
- Use the Data Filter on all plot types that use data files as input
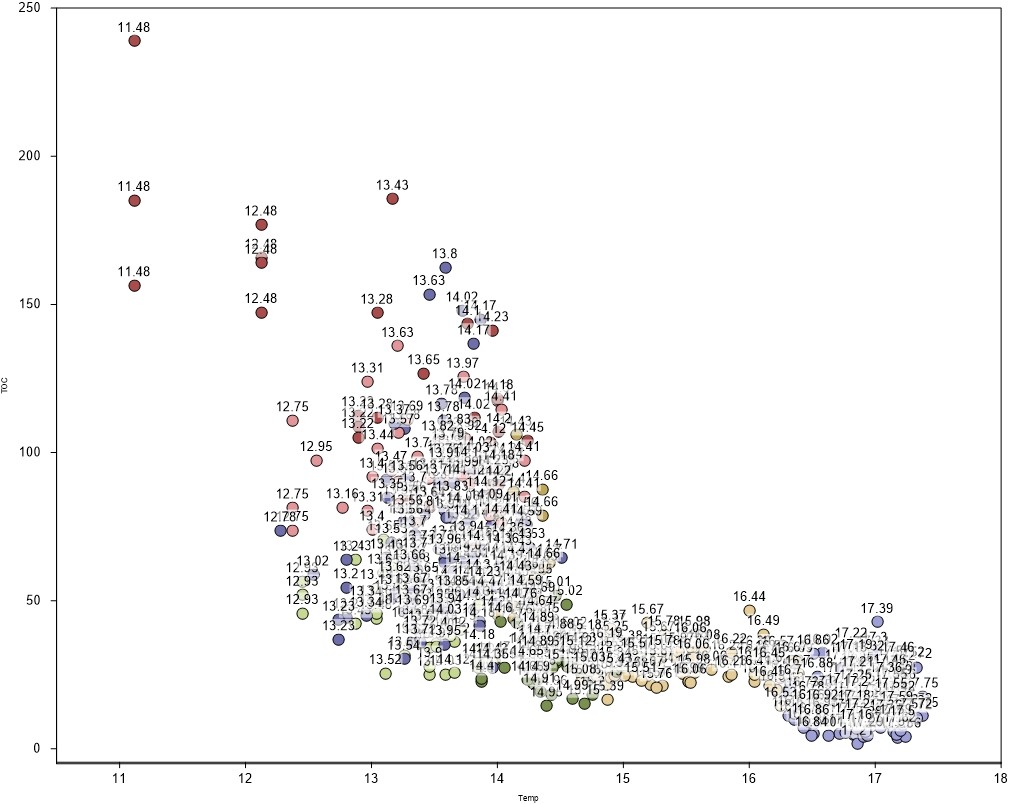
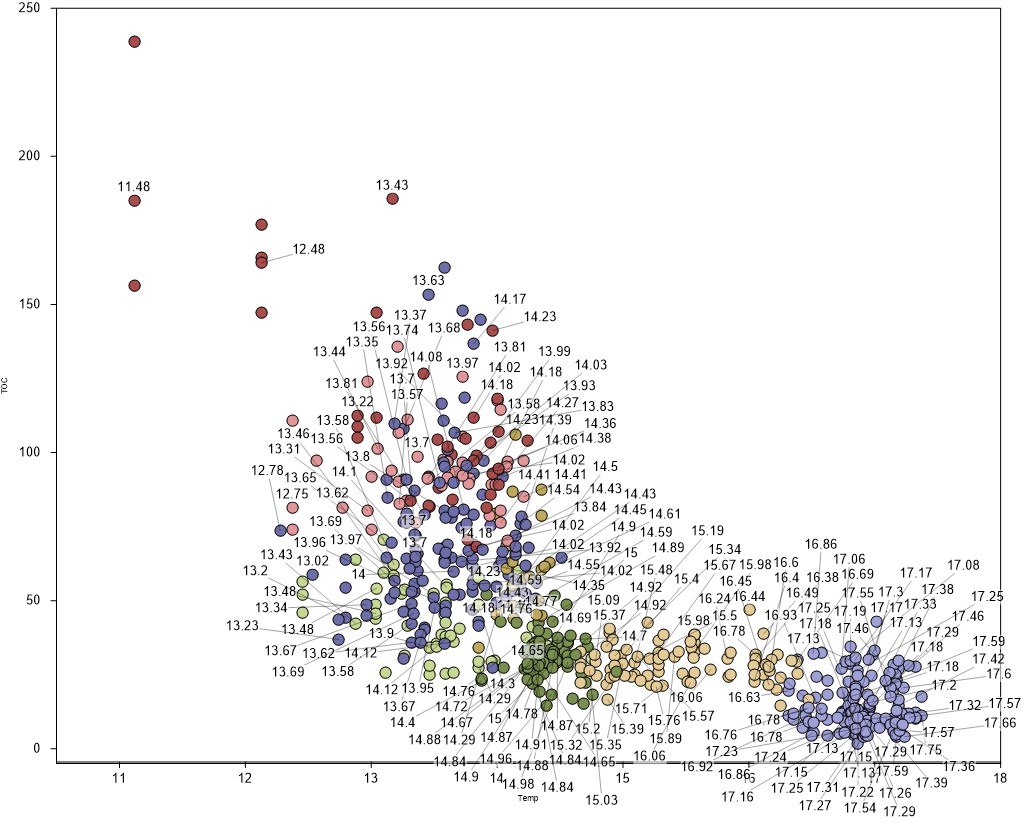
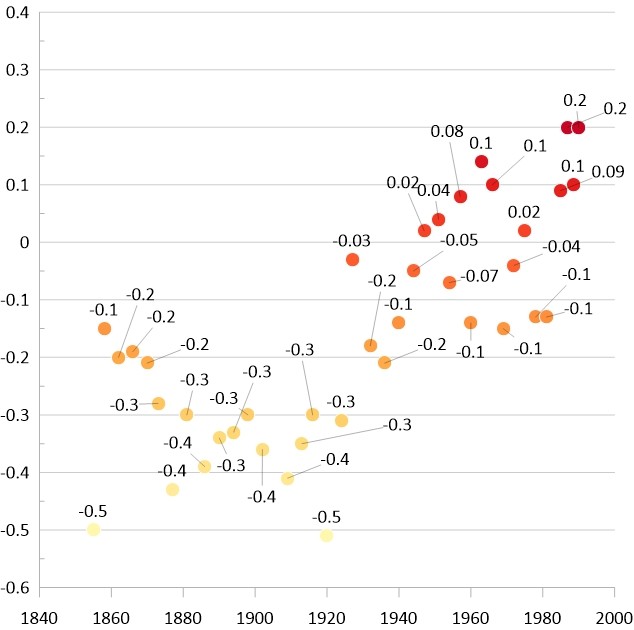
This new feature allows you to easily offset any overlapping labels in your plot – it can even be used on multiple plots at once. This is a big time saver if you frequently work with clustered or dense data. After the plot labels are dispersed, you can still fine-tune individual label positions with manual click-and-drag editing options.
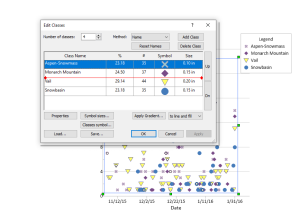
Up until now the Class Plot Legend for text classes has always been ordered in the order of items in the worksheet, Now you can re-order text classes using whatever system you like. This has been a highly requested new feature and we’re happy to bring it you with this release of Grapher Beta!
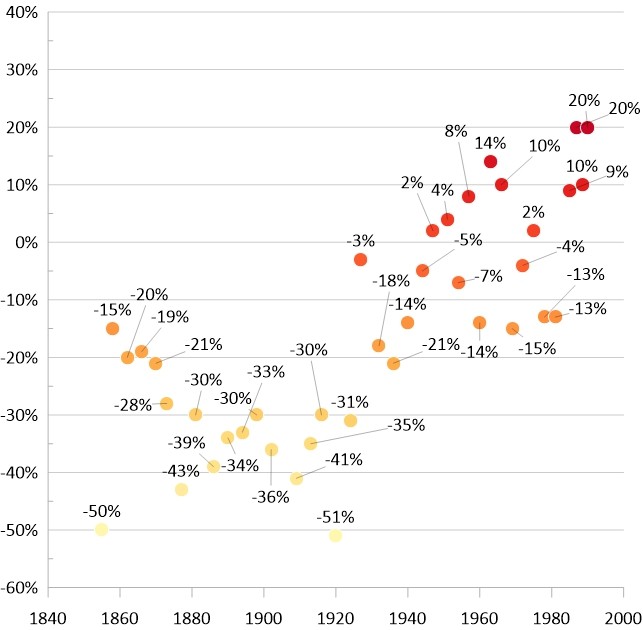
This new label formatting option converts your numeric data in the worksheet to percentage format, and adds the % sign suffix. This means less time spent manually converting decimal data to percentages in the worksheet.
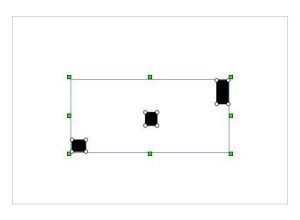
Easily arrange your plots, text, and shapes on the page by using the new Align to Margins and Distribute in Margins commands. These new tools will help you center objects on the page, assist with creating evenly spaced matrix layouts, and prepare your plots for publication.
Status Bar improvements
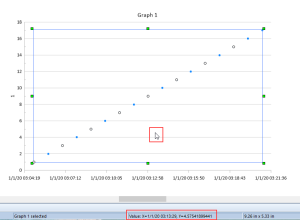
The Status Bar now shows the position of the mouse cursor in the units of the selected plot axes. If your axes are in Date/Time format, Grapher Beta will match the formatting you have chosen for the axis labels, even down to hours/minutes/seconds.
Digitize in the Date/Time Format of Your Axes
You can now also digitize on your plot, and the digitized points will be recorded in the Date/Time format of your axis labels. This removes the need to convert from Julian dates back into your preferred Date/Time format for post-processing.
Automatically Reduce Clutter with the Worksheet Manager
Reduce clutter in the Worksheet Manager! When data files are unlinked from the plot, they are automatically closed in the Worksheet Manager. This new feature will help keep you organized!
We hope you enjoy the latest Grapher release and as always we want to hear your feedback on new features and improvements! Share your thoughts or reach out for assistance at graphersupport@goldensoftware.com.
