Unleash Creativity and Efficiency with Grapher’s Latest Release
At Golden Software, your feedback is invaluable, fueling our dedication to improving Grapher. The latest releases of Grapher 23 and Grapher 24 Beta are engineered to enhance your data visualization experience whether you’re a seasoned Grapher pro or a first time user.
“We deeply value our user’s feedback, which drives our commitment to enhancing Grapher. Making graph customizations more intuitive and efficient isn’t just about software updates; it reflects our dedication to prioritizing user workflows in our development process. With Grapher 23 and Grapher 24 Beta, we’re excited to deliver on these insights, allowing our users to streamline their data visualization experience in ways never before possible.”
– Santiago Vivas, Grapher Product Manager
Grouped Box Plots: A Game Changer
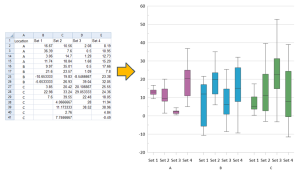
Statistical analysis with box plots is easier than ever with this new update. No more wrestling with pivot tables or manual data layout adjustments. Use your data as is to clearly visualize all data in one easy to create graph.
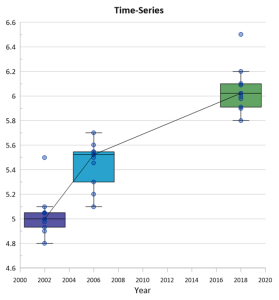
As a bonus, grouped box plot axes also allow you to combine your box plots with other plot types to make your data’s story even more compelling.
Discover More with Grapher 24
We’re on a mission to make Grapher the most powerful and user-friendly data visualization tool available. Discoverability is key so we’ve made tools like the text editor, gradient fills, adding plots to graphs, and adding data or images to your graphs easier to find and use.
Organize like a Pro
Ever felt overwhelmed by cluttered project data? Grapher 24 introduces the ability to move and copy pages between files, helping you keep your projects tidy and organized. It’s like having a digital Marie Kondo at your fingertips!
Whether you’re a seasoned data scientist, a marketing professional making sense of consumer trends, or a student tackling your first big research project, these updates are designed to make your life easier and your work more impactful. Your data has stories to tell. Let Grapher be its voice.
Graph with ease
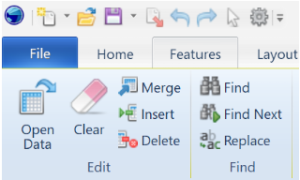
The File | Import command has been incorporate into the File | Open command, matching the functionality of Surfer and making opening files easier for all users. You can open all of Grapher’s supported file types with only one command! This change not only makes the software more intuitive but also accelerates the initial stages of data visualization.
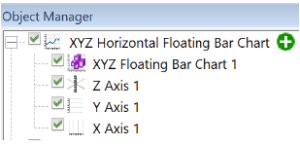
Adding the new green “add plot” button directly next to Graph in the Object Manager was a deliberate move to simplify the process of enhancing graphs with additional plots. Recognizing that users needed a more straightforward way to expand their analyses, this button was introduced to make the addition of new plots intuitive and instant. It eliminates the need for navigating through the ribbon and menus, significantly speeding up the workflow and encouraging users to explore more complex data visualizations without the hassle.
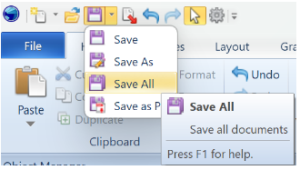
The introduction of the File | Save All feature in Grapher directly caters to users who work with multiple documents simultaneously. This feature streamlines the saving process, allowing for all open documents to be saved in one simple action. It’s a practical enhancement designed to save time, reduce the risk of data loss, and bring an extra layer of convenience to the Grapher user experience, especially beneficial for those managing extensive data analyses or multiple projects.
Customize with Certainty
The old text editor symbol (𝚺) has been replaced with a straightforward “Text Editor” button as a thoughtful enhancement aimed at demystifying functionality for our users. This change is about clarity and ease of access, ensuring that every user can intuitively understand and utilize the text editing features within Grapher. By making this tool immediately recognizable our users can create more efficient and creative graph annotations and text manipulations.

We’ve made the plot fill gradient properties more visible in Grapher, addressing feedback that this was not easy to find and could be confusing. This improvement aims to balance user-friendliness with functionality, enabling users to effortlessly choose between pattern and gradient fills to enhance their graphs.

