Explore the Moon’s Soils with 3D Modeling
One of our Surfer users Alain Paillou has been kind enough to share his work with us – he has been using the new 3D view features to generate 3D models of the Moon’s surface and analyze the soil. Please read on!
My name is Alain Paillou, I’m a hydrogeologist and I work for the French Environment Minister. I study surface and groundwater quality in the Bourgogne Franche-Comté region. As I have to deal with a huge amount of environmental data, I need very powerful tools to be able to understand and explain how human activity can modify water quality. One of my favourite tools is Golden Software’s Surfer, which allows me to create maps of water quality in my region.
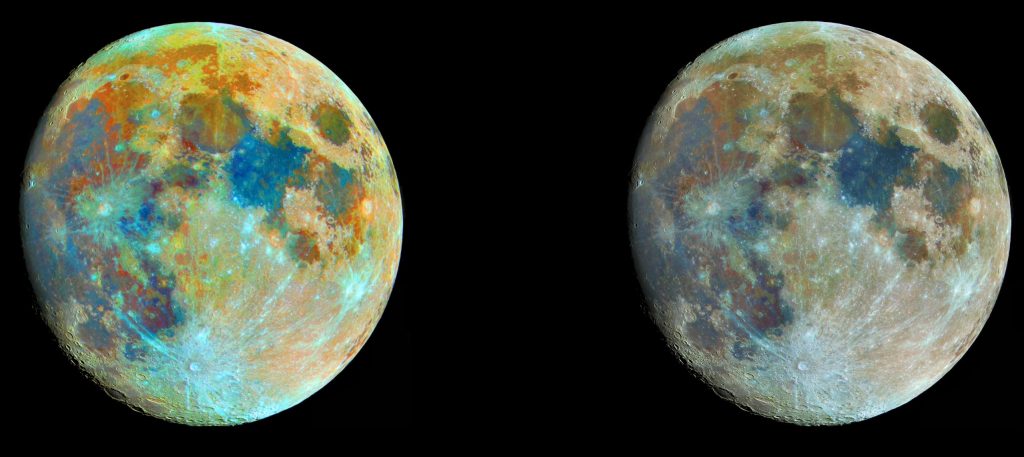
I’m also an amateur astronomer and one of my favourite subjects is the Moon. Modern astronomy equipment is quite amazing, allowing us to study the Moon’s geology without relying on satellite imagery. New amateur telescopes can easily show you spectacular views of the planets and deep sky objects. I used a Celestron C9.25 telescope and a ZWO ASI178MC camera to capture the true colours of the Moon’s soils.
When you look at the Moon, you will mostly see grey colours. If you look very closely, you will be able to see very light colours, mostly blue and orange in the Seas (the Lunar Maria – large basaltic plains originally mistaken for oceans by early astronomers). Yes, the Moon has colours! Using modern planetary cameras, it is possible to create very clear photos of the Moon’s surface, and with those images and appropriate treatment, you can show true colour of the soils.
These colours come mainly from metallic oxides in small glass structures in the soils (blue indicates the presence of titanium, while red means iron is present). We can also see green colours that could be silicates, and it is possible to see dark brown areas that are probably pyroclastic deposits which may contain a significant quantity of water. To get a more beautiful picture, we can superimpose a detailed monochrome photograph of the Moon with a colour image from the telescopic camera. With this kind of composite picture, you can have a very realistic picture of a detailed Moon that also reveals information of the soil’s composition.

Left: With my telescope, colour camera and software processing, I can show the natural colours of the Moon soils. The theory is quite simple (just enhance the colour saturation) but the practice is very difficult. This is a near full moon colour image of the soils I created. Right: I use the coloured image with detailed monochrome Moon images to get very sharp coloured Moon pictures. These composite images are then superimposed on the LRO DEM
Elevation is also important to understand the Moon’s surface structure and to have a better understanding of our natural satellite. Similar to Earth, geological structures such as crater impact sites, mountains and plains – as well as surface elevation – reveal information about the history of the Moon. Lucky for us, NASA’s Lunar Reconnaissance Orbiter (LRO) made a highly detailed digital elevation model (DEM) of the Moon surface, and this data is freely available from their website as grid downloads.

NASA’s LRO DEM of Moon Southern Hemisphere (left) and Northern Hemisphere (right) with 85m spacing, visualized in Surfer’s 3D View.
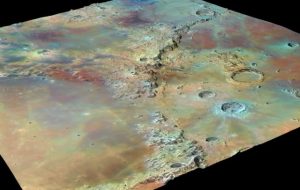
To make a more realistic picture, we can overlay the 3D DEM model with the coloured composite image. Colours match very well with Moon geological maps (NASA/USGS) and the colours we found in the Seas and around crater impacts provides very detailed information (much more detailed than that which can be found in geological maps).
For instance, the colours provide an indication of the melting history. We see that there is a colour gradient between the base geology (orange) and the overlying basaltic Sea geology (blue). For my interpretation, melted material of the Seas liquefied the upper part of the base, and so there was a mixing of two materials (giving purple colours). Strong blue colours indicate thick Seas, violet for thinner Seas, and orange for exposed base. This is because where the Seas are thick, the mixing zone with the base is deeper. We can also distinguish brown for the base flush or sub flush. The colour thus makes it possible to differentiate the edges of the seas and better still, it gives an idea of the base geology under this material. From a top view, we can infer the appearance of the land and topography before the basaltic Seas filled the depressions. We can distinguish the links between the emerged parts and the sub-flush areas in brown and purple. Overall, the soil colors must indicate mechanisms of recovery and mixture with the underlying material.
The new 3D modeling functionality in Surfer allows me to create a fly-over video using the LRO Moon DEM with my superimposed photography. This is really cool!
Alain’s YouTube channel has many fly-overs, videos and astronomical photography. Check it out here!


